The Nasdaq staged a mild recovery yesterday due to a slight improvement in risk sentiment and bears failure to set a new low below Friday’s drop zone, close to the 14,000 level.
Although tensions with the Ukraine and Russia have also started to ease somewhat, Wednesday appears to be D-Day for financial markets, with most political pundits expecting this to be the invasion date.
Going forward, I think we have to be sceptical of any price bounces in the Nasdaq, until we see confirmation that a major conflict is not going to happening. Trading geopolitical events is incredibly risky.
Usually, I have a key rule with major geopolitical events, I don’t trade them. This is because the news feeds can be bullish or bearish and quickly take you out of your position.
Therefore, it is more of a guessing game. For me, it is better to await a definitive outcome before entering back into positions. So trading the Nasdaq is probably safer for scalpers than traders making intraday directional bets.
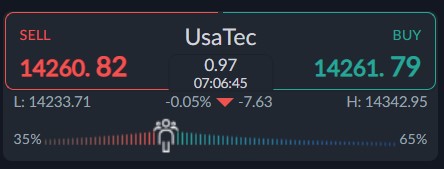
The ActivTrader market sentiment tool is showing that some 65 percent of traders are bullish towards the US dollar index, which is a drop since last week, whereby 77 percent of traders were bullish.
The fact that sentiment is starting to decline is mildly bullish, however, I would prefer the herd to flip to negative before I think we see a meaningful price bottom forming for the Nasdaq.
US100 Short-term Technical Analysis
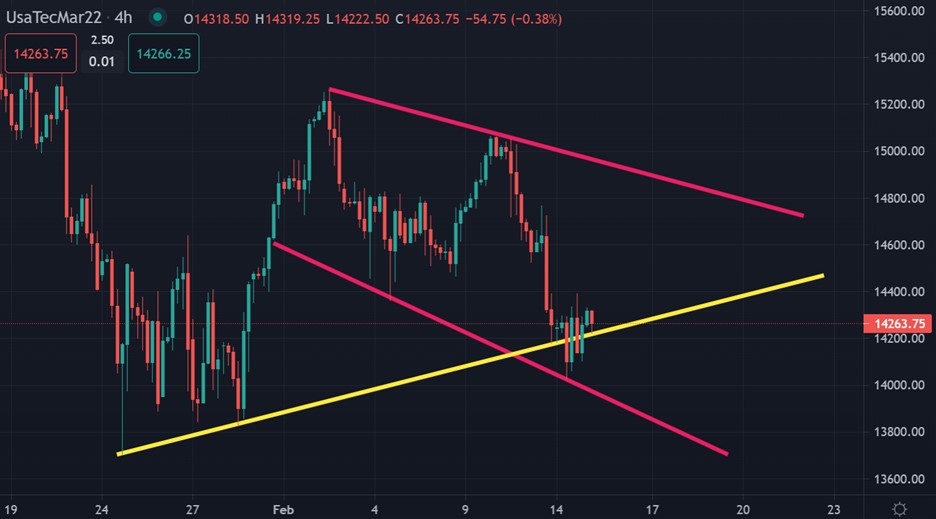
Looking at the four-hour time frame, the technicals show that the Nasdaq is trading inside a large descending expanding wedge pattern. These patterns are typically bullish patterns.
The fact that the price has bounced somewhat is mildly bullish. Any bearish reversal from current levels and we could well see a final test of the 14,000-support area.
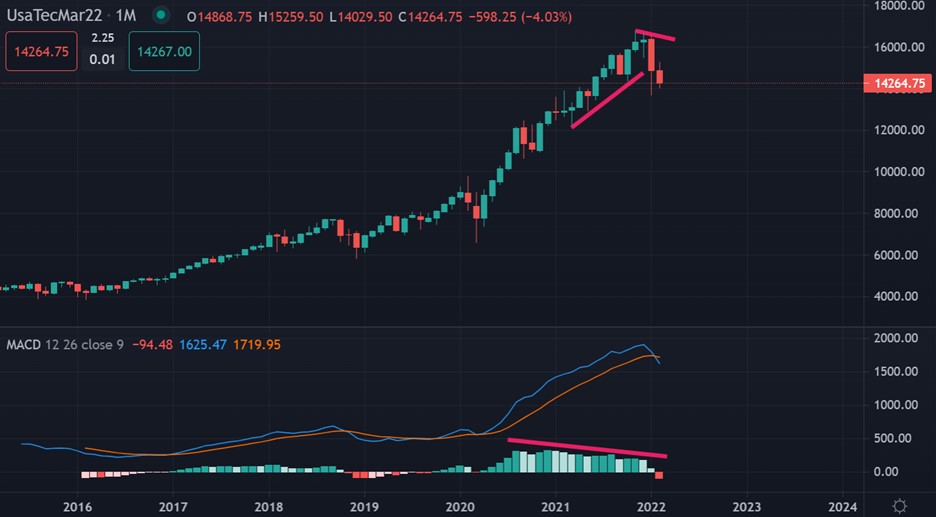
The medium-term picture for the Nasdaq still looks to be uncertain for me, due to the fact that significant amounts of negative MACD price divergence is still evident on the charts.
Looking at the monthly time frame, huge amounts of negative MACD price divergence is found around the 13,000 and 10,000 level. For me, the 13,000 to 12,000 level area looks highly probable to me if 14,000 support breaks.


