fbpx
High Leverage FX
  • Home
  • Market News
    • All
    • Economy
    • Forex
    • Markets
    • Opinion
    • Politics
    • Tech
    • World
    Asian equities could take a boost after strong gains seen on US equities

    Asian equities may trade on the back foot as traders took profits during Wall Street session

    USDMYR Technical Analysis

    USDMYR Technical Analysis

    Asian equities observe positive start as optimism on Wall Street echoes

    Asian equities could trade with negative bias reflecting caution awaiting Nvidia’s earnings report

    Asian equities could take a boost after strong gains seen on US equities

    Asian equities likely to trade within narrow range following volatile session on Wall Street

    Asian markets may experience volatility as global participants eagerly await significant upcoming events

    Asian markets may experience volatility as global participants eagerly await significant upcoming events

  • Economic Calendar
  • About Us
  • Trading Signals
  • Free Demo Account
High Leverage FX
No Result
View All Result
Home Market News Markets

UK100 Technical Analysis – Triangle Break

Nathan Batchelor by Nathan Batchelor
January 12, 2022
in Markets
Reading Time: 3 mins read
0
UK100 Technical Analysis – Triangle Break
458
SHARES
12.1k
VIEWS
Share on FacebookShare on Twitter

The FTSE 100 has risen to its highest trading level since February 2020, after breaking above a huge triangle pattern on the higher time frames, further underpinning technical buying.

Yesterday, UK stocks again alongside global stock indexes as investors were relieved that Federal Reserve Chair Jerome Powell’s testimony to Congress did not include any major surprises.

United States Federal Reserve Chair Jerome Powell basically said that the United States economy can withstand QE tightening and Omicron, setting expectations of growth during a period of a withdrawal of stimulus.

On price action alone, the UK100 has been incredibly strong, and arguably looking much more bullish that CAC40 or even the DAX40, as selling interest in dips has been very muted.

Most traders are going to be on standby for the US inflation report today, which threatens to send tremors through financial market if a much-strong headline number is announced.

For me, we need to pay close attention to the top of the triangle, close to the 7,500 area, which is really a pivotal level for the medium-term direction of the leading UK index.

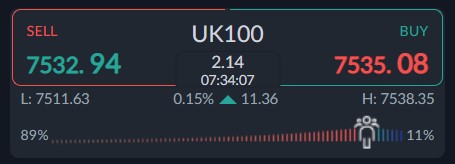
Sentiment towards the UK100 is starting to turn heavily negative, which is a good sign for buyers. According to the ActivTrader platform some 89 percent of traders are bearish towards the UK100.

This is a big increase in bearish sentiment since last week, which is worrying. Ideally we need to see bullish sentiment in order for a big correction to take hold. It looks like the breakout could be genuine.

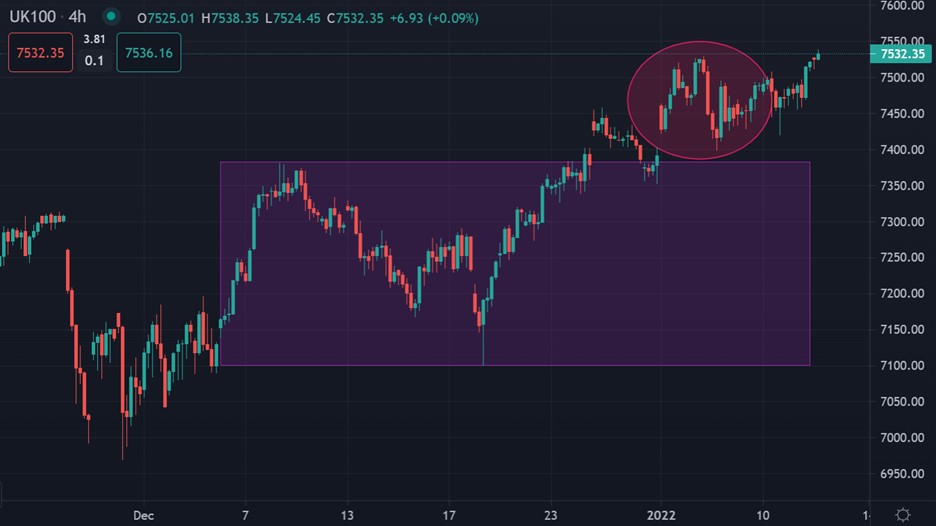
UK100 Short-Term Technical Analysis

The four-hour time frame shows that the FTSE100 has ignited a large, inverted head and shoulders pattern. These types of patterns are typically extremely bullish.

Looking at the inverted head and shoulders pattern, a rally towards the 7,700 level is coming. Additionally, a head and shoulders pattern with a 100-point projection has been invalidated.

See real-time quotes provided by our partner.

UK100 Medium-Term Technical Analysis

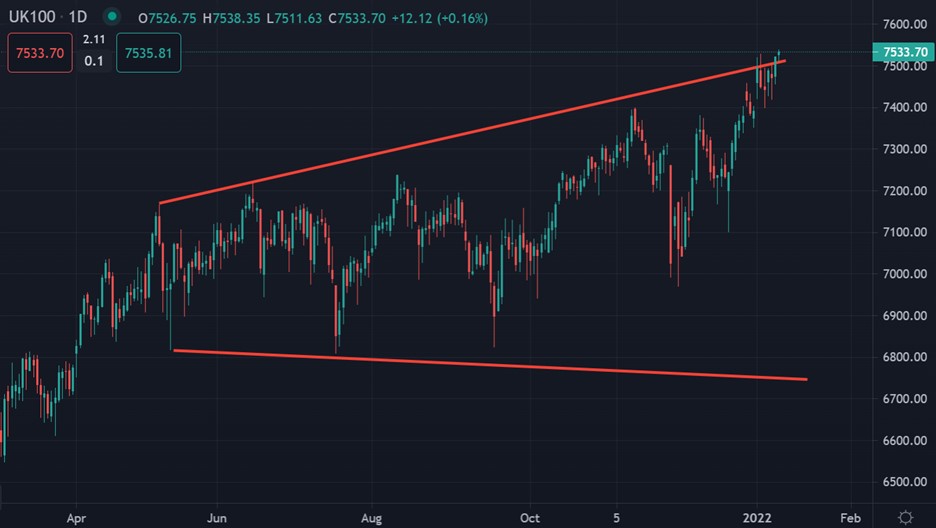
The daily time frame shows that the FTSE100 has broken above a large triangle pattern. The break above the triangle is likely to see the index moving significantly higher.

It should be noted that the top of the top of triangle pattern sits around the 7,500 level. If the breakout from the top of the channel holds then a massive price rally could take hold. The same is also true if we see a big rejection.

See real-time quotes provided by our partner.

Tags: CAC40DAX40FEDFTSE100
Previous Post

AUDUSD Technical Analysis - Buy signal still in play

Next Post

USD/MYR Technical Analysis

Nathan Batchelor

Nathan Batchelor

Related Posts

Asian equities could take a boost after strong gains seen on US equities
Markets

Asian equities may trade on the back foot as traders took profits during Wall Street session

May 23, 2024
Asian equities observe positive start as optimism on Wall Street echoes
Markets

Asian equities could trade with negative bias reflecting caution awaiting Nvidia’s earnings report

May 23, 2024
Asian equities could take a boost after strong gains seen on US equities
Markets

Asian equities likely to trade within narrow range following volatile session on Wall Street

May 22, 2024
Asian markets may experience volatility as global participants eagerly await significant upcoming events
Markets

Asian markets may experience volatility as global participants eagerly await significant upcoming events

May 21, 2024
Asian equities might experience mixed trading due to profit-taking and anticipation of options expiry trades
Markets

Asian equities might experience mixed trading due to profit-taking and anticipation of options expiry trades

May 17, 2024
Asian equities may experience significant sell-off following the lead of the US
Markets

Asian equities likely to trade positively following significant rally in US stocks and bonds

May 16, 2024
Next Post
USDMYR Technical Analysis

USD/MYR Technical Analysis

Leave a Reply Cancel reply

Your email address will not be published. Required fields are marked *


Market Overview

Categories

  • Economy
  • Forex
  • Gadget
  • Markets
  • Opinion
  • Politics
  • RSS Feed
  • Startup
  • Tech
  • Trading Signals
  • Uncategorized
  • World

Site Navigation

  • Home
  • Market News
  • Economic Calendar
  • About Us
  • Trading Signals
  • Free Demo Account
  • Home
  • Market News
  • Economic Calendar
  • About Us
  • Trading Signals
  • Free Demo Account

© 2019 High Leverage FX - All Rights Reserved.

No Result
View All Result
  • Home
  • Market News
    • Forex
    • Economy
    • Opinion
    • World
    • Markets
    • Politics
  • Economic Calendar
  • Trading Signals
  • About Us
  • Free Demo Account
[gtranslate]

© 2019 High Leverage FX - All Rights Reserved.