The New Zealand dollar has had a horrid week on the foreign exchange market against the US dollar last week, as the pullback from the 0.7200 resistance level continues to gather pace.
It is a fair comment to say that the losses in the NZDUSD pair are not too severe as compared to the GBPUSD or EURUSD pair, seeing as the NZDUSD pair is only 200 points away from its yearly high.
If we compare this with the GBPUSD and EURUSD pair, the GBPUSD pair is nearly 1,000 points away from 2021 trading high, while the EURUSD is also close to 1,000 points lower.
This simple comparison lets us know that the New Zealand dollar is still quite strong compared to other G-7 currencies. The question now is how low can the NZDUSD pair go?.
The main correction spot, and potential huge dip-buying opportunity, appears to be the top of a falling wedge pattern, close to the 0.6855 area. It is possible that if the NZDUSD pair crack the 0.7000 support level then the NZDUSD could fall sharply.
With the US dollar index breaking to the upside, much will depend on what the buck does. Gains past the 95.00 mark and the US dollar index could easily hit 98.00, which would send the NZDUSD pair much lower
Failure in the US dollar index around the 95.00 mark and the NZDUSD pair could rally from the 0.7000 level. In summary, the potential reversal spot is either 0.7000 or 0.6855 in my opinion.
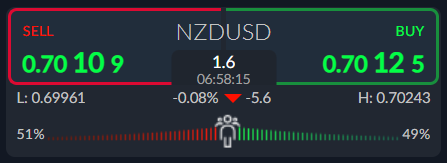
According to the ActivTrader market sentiment tool some 51 percent of traders are bearish towards the NZDUSD pair. As we typically look to fade sentiment biases, this is making it to read sentiment as a leading indicator now.
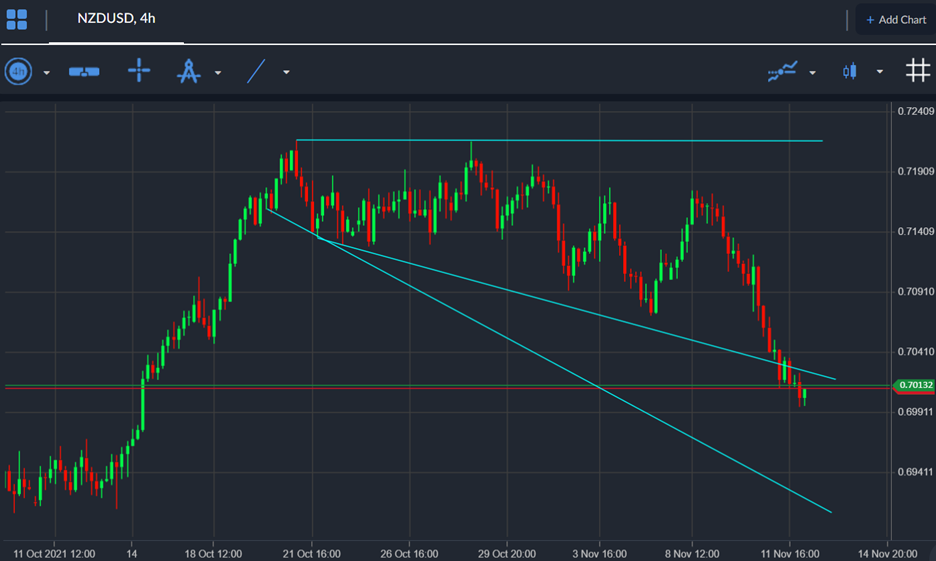
NZDUSD Short-Term Technical Analysis
The four-hour time frame shows that a breakout from an ascending triangle pattern is currently underway. This is not a good sign for bulls looking for a reversal from the 0.7000 level.
If the breakout holds then a correction back to the 0.6900 to 0.6850 region seems plausible. If bulls recover the breakout, then a rally towards the 0.7250-0.7280 level is likely.
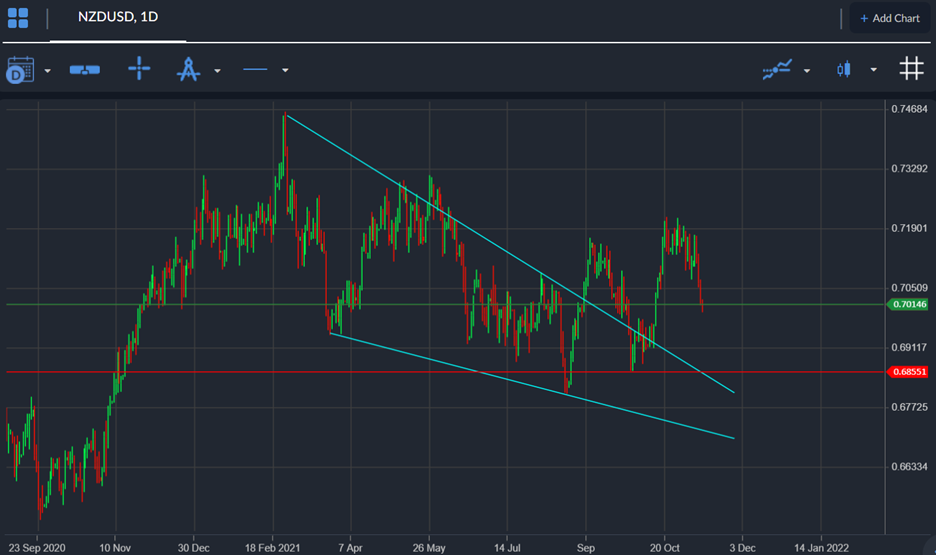
The daily time frame shows that the pair looks to be targeting a retest of a large falling wedge pattern. These types of patterns are typically considered to be classic bullish reversal pattern.
According to technical analysis a retest of the wedge seems more likely than while the NZDUSD pair trades under the 0.7000 level. Buying a retest of the wedge breakout around the 0.6855 level seems the best strategy for the bulls.


