The EURUSD pair has started to break to the upside as the US dollar index starts to crack critical weekly technical support after being rejected from the top of its yearly range last week.
Make no mistake, this could be significant. Energy and momentum had been gathering around the 1.1600 area recently which hinted that a wider recovery may be coming.
EURUSD bulls do face a challenge from current levels, and they will need to see the US dollar index continuing to plunge lower. A daily price close above the 1.1900 level is needed for the medium-term trend to turn bullish again.
The good news is that technical analysis on the daily time frame shows that the EURUSD pair could surge towards the 1.1800 area relatively easily once the 1.1660 level is broken.
Other interesting dynamics are also at play. The EURGBP pair is starting to recover after last weeks big sell-off, as British pound traders become cautious ahead of this weeks CPI report, creating further tailwinds for the single currency.
Something that is extremely interesting right now is that traders are not bearish towards the EURUSD. Unusually, the pair is ramping higher without a clear sentiment skew.
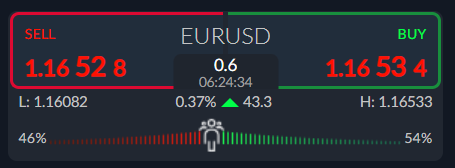
The ActivTrader Market Sentiment tool shows that some 54 percent of traders are bullish towards the EURUSD. This is a big drop in bullish sentiment since last week, which is good.
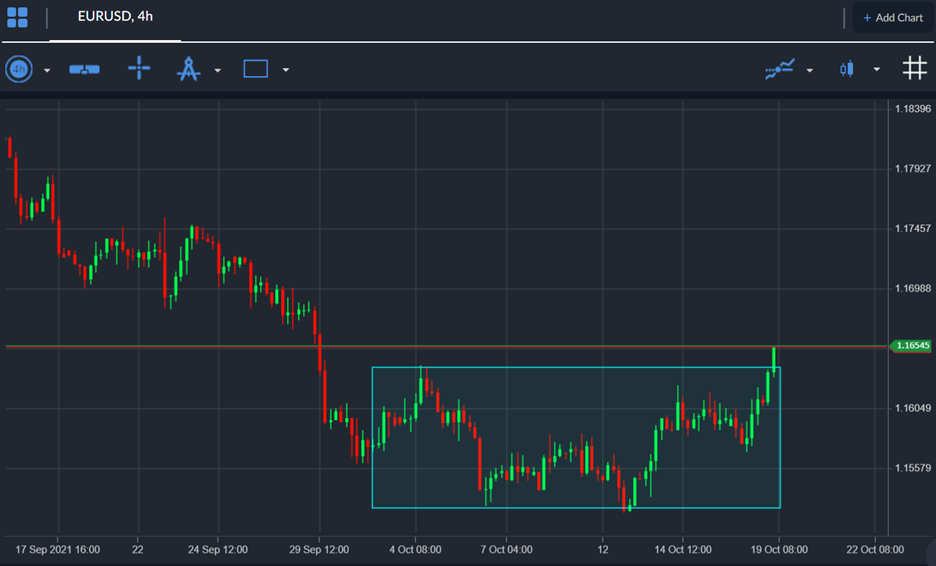
EURUSD Short-Term Technical Analysis
The four-hour time frame shows that the EURUSD pair has ignited an extremely large, inverted head and shoulders pattern, which could propel the EURUSD pair towards the 1.1750 area.
Upside failure hear would be very bad indeed for bulls, however, it seems unlikely given the positive risk-on sentiment and energy surrounding the US dollar sell-off, which is broad based.
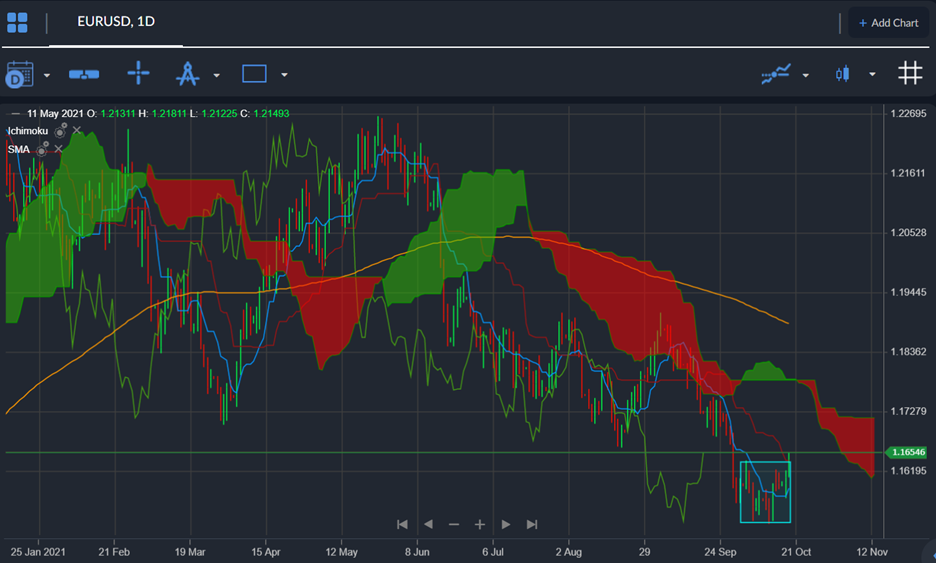
Looking at the daily time frame things looks good for the EURUSD pair as the Ichimoku indicator shows that the price has moved above the Tenkan Sen line and the Kijun sen line.
If the EURUSD pair continues to hold above these areas, then watch for an attack toward Ichimoku cloud resistance around the 1.1795 region or even the 200-day MA, at 1.1900.


