fbpx
High Leverage FX
  • Home
  • Market News
    • All
    • Economy
    • Forex
    • Markets
    • Opinion
    • Politics
    • Tech
    • World
    Asian equities could take a boost after strong gains seen on US equities

    Asian equities may trade on the back foot as traders took profits during Wall Street session

    USDMYR Technical Analysis

    USDMYR Technical Analysis

    Asian equities observe positive start as optimism on Wall Street echoes

    Asian equities could trade with negative bias reflecting caution awaiting Nvidia’s earnings report

    Asian equities could take a boost after strong gains seen on US equities

    Asian equities likely to trade within narrow range following volatile session on Wall Street

    Asian markets may experience volatility as global participants eagerly await significant upcoming events

    Asian markets may experience volatility as global participants eagerly await significant upcoming events

  • Economic Calendar
  • About Us
  • Trading Signals
  • Free Demo Account
High Leverage FX
No Result
View All Result
Home Market News Markets

Dow Jones Industrial Average Technical Analysis-Trendline Breakout Confirmed

Nathan Batchelor by Nathan Batchelor
September 15, 2021
in Markets
Reading Time: 2 mins read
0
Dow Jones Industrial Average Technical Analysis-Trendline Breakout Confirmed
379
SHARES
9.1k
VIEWS
Share on FacebookShare on Twitter

The Dow Jones Industrial Average has been weakening again, due to an increase in fears about the global economy and worry data inside the latest Consumer Price Index report from the United States economy.

Earlier this week the DJIA moved back to test towards the 35,000-resistance level, which denoted a huge multi-month trendline breakout that took place last week. The rejection seems very bearish technically.

Traders have also been reacting to the August CPI inflation report. CPI in the US rose 0.3% in August, down from a 0.5% rise in July and below the 0.4% projection that economists had made.

However, the year-over-year CPI number raised concern amongst investors. CPI has rose 5.3% over the past 12 months, while core CPI was up 4% from where it was this time last year.

The data showed gasoline prices were up another 2.8%, marking the third straight month of increases of more than 2%. New vehicle prices kept up their steady rise, climbing 1.2% during the month.

Due a generally downbeat mood towards the global economy the DJIA looks primed for further loses. The technicals and fundamentals are aligning, as it the latest sentiment data.

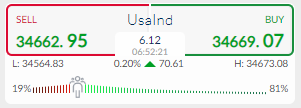
Sentiment towards the index is worryingly bullish at the moment. The ActivTrader Market Sentiment tool shows that some 81 percent of traders are currently bullish towards the DJIA, despite the recent price pullback. This is very significant, as it may suggest further heavy losses are coming.

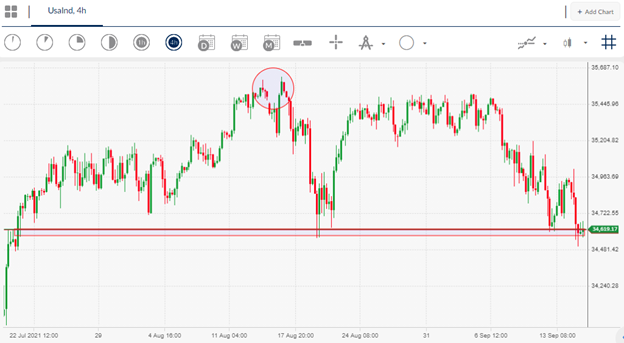
Dow Jones Industrial Average Short-Term Technical Analysis

The four-hour time frame shows that a bearish head and shoulders pattern has now officially formed, following the recent price drop towards the August monthly price low..

According to technical analysis the pattern will be activated if the price golds under the 34,700-support level. The size of the pattern implies that a drop towards at least the 34,000 level is coming.

See real-time quotes provided by our partner.

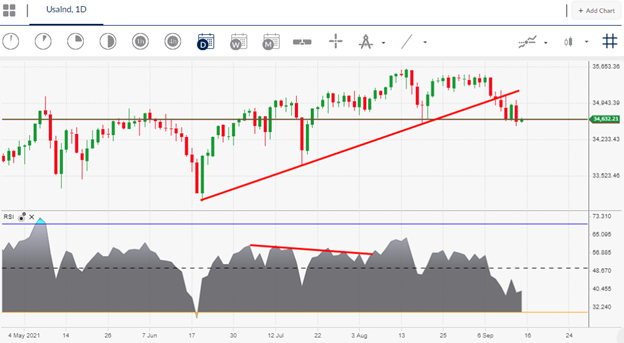
Dow Jones Industrial Average Medium-Term Technical Analysis

Looking at the daily time frame a major multi-month trendline breakout has taken place, which is further increasing downside pressure. The recent weekly candle also closed below the trendline.

Large swaths of negative price divergence are seen across the RSI indicator, with the negative price divergence extending down towards the 37,300 area at a minimum.

See real-time quotes provided by our partner.

Tags: CPI dataDow Jonesus economy
Previous Post

Asia equities trading moderately after losses on Wall Street

Next Post

CADJPY Technical Analysis - Bearish pattern looms

Nathan Batchelor

Nathan Batchelor

Related Posts

Asian equities could take a boost after strong gains seen on US equities
Markets

Asian equities may trade on the back foot as traders took profits during Wall Street session

May 23, 2024
Asian equities observe positive start as optimism on Wall Street echoes
Markets

Asian equities could trade with negative bias reflecting caution awaiting Nvidia’s earnings report

May 23, 2024
Asian equities could take a boost after strong gains seen on US equities
Markets

Asian equities likely to trade within narrow range following volatile session on Wall Street

May 22, 2024
Asian markets may experience volatility as global participants eagerly await significant upcoming events
Markets

Asian markets may experience volatility as global participants eagerly await significant upcoming events

May 21, 2024
Asian equities might experience mixed trading due to profit-taking and anticipation of options expiry trades
Markets

Asian equities might experience mixed trading due to profit-taking and anticipation of options expiry trades

May 17, 2024
Asian equities may experience significant sell-off following the lead of the US
Markets

Asian equities likely to trade positively following significant rally in US stocks and bonds

May 16, 2024
Next Post

CADJPY Technical Analysis - Bearish pattern looms

Leave a Reply Cancel reply

Your email address will not be published. Required fields are marked *


Market Overview

Categories

  • Economy
  • Forex
  • Gadget
  • Markets
  • Opinion
  • Politics
  • RSS Feed
  • Startup
  • Tech
  • Trading Signals
  • Uncategorized
  • World

Site Navigation

  • Home
  • Market News
  • Economic Calendar
  • About Us
  • Trading Signals
  • Free Demo Account
  • Home
  • Market News
  • Economic Calendar
  • About Us
  • Trading Signals
  • Free Demo Account

© 2019 High Leverage FX - All Rights Reserved.

No Result
View All Result
  • Home
  • Market News
    • Forex
    • Economy
    • Opinion
    • World
    • Markets
    • Politics
  • Economic Calendar
  • Trading Signals
  • About Us
  • Free Demo Account
[gtranslate]

© 2019 High Leverage FX - All Rights Reserved.