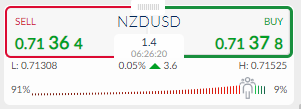
The New Zealand dollar is trading at a make-or-break point against the US dollar as the pair trades above the 0.7100 resistance level as commodity-related currencies prices surge against the buck last week.
From a technical perspective, the NZDUSD pair is testing towards the top of a huge falling wedge pattern around the 0.7140 level. Gains above this level could propel huge gains towards the 0.7300 level and possibly much higher.
On the fundamental front, the notion that the FED will continue to implement QE after last Friday’s soft jobs report has helped lift the NZDUSD pair even higher in the aftermath of the Jackson Hole inspired US dollar sell-off.
Traders are currently betting that the move in the NZDUSD pair is going to fizzle out anytime and reverse according to ActivTrader market sentiment tool, which shows a huge sentiment bias has built.
According to the ActivTrader market sentiment tool, some 91 percent of traders are bearish towards the NZDUSD pair. The sentiment skew has been getting more and more bearish as the price has risen.
Usually, retail traders on the wrong side of the trend, as we have seen over recent weeks with the NZDUSD pairs dramatic rise as the herd stayed bearish. The 91 percent sentiment skew suggests that a huge reversal could take place at any time. So traders need to be careful over the coming days.
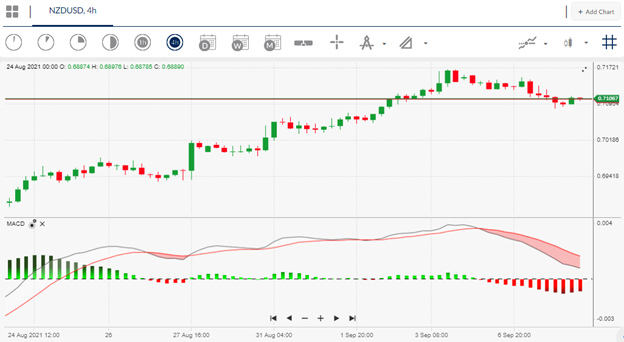
NZDUSD Short-Term Technical Analysis
The four-hour time frame continues to show that the NZDUSD pair has formed huge amounts of negative MACD price divergence during its recent price ramp towards the 0.7140 area.
According to the overall size of the bearish MACD a reversal down towards the 0.6940 area could take place at any time in order for the divergence to be fully reversed. Bulls do need to be very careful around current levels.
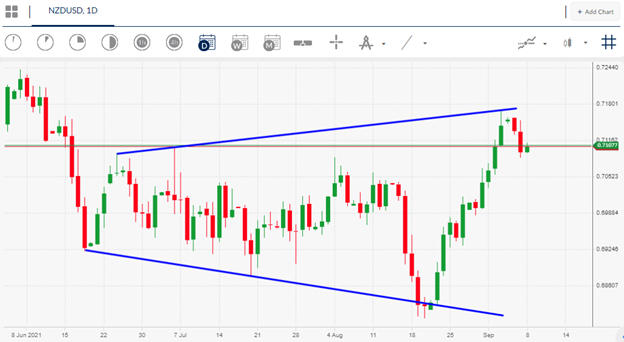
The daily time frame shows that the NZDUSD has reached a make-or-break point, with the pair reaching the top of a large falling wedge pattern, which is historically been known as a bullish reversal pattern.
I believe that if an upside breakout from the pattern take place then a further price ramp towards the 0.7300 level will take place. If bulls fail to follow through then a reversal towards the mid-point of the pattern, around the 0.7150 level, is highly probable.


