The price of gold continues to consolidate above the $1,800 level as traders await confirmation from the Non-farm Payrolls jobs as to whether or not a new bullish price trend is starting.
As stated by Federal Reserve Chair Jerome Powell last week, the jobs situation is going be one of the key determinants as to whether the US central bank start to taper QE later this year.
Traders are naturally cautious as a strong jobs report could quickly sink the recovery in gold, which started to pick-up steam last week after Jackson Hole after Powell sounded more dovish than many expected.
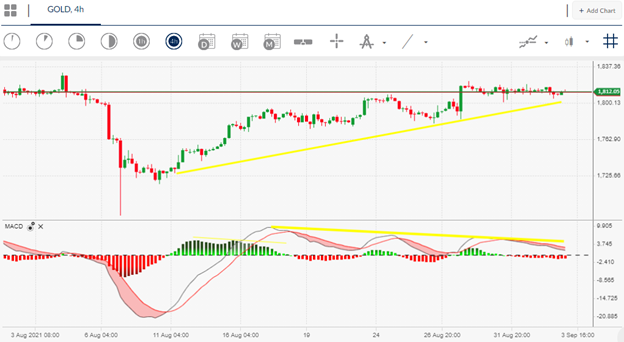
Bearish price divergence is also offering a warning that the current up move may not be the real deal. Lower time frame analysis shows that significant amount of bearish price divergence is present until the 1,750 regions.
It is more likely that not that the divergence will be released if we see a strong jobs number. Of course a weak number could cause gold price to rally further, but we should be mindful of the mentioned price divergence.
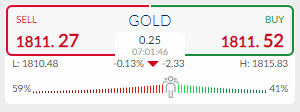
Current sentiment metric towards gold is currently suggesting further gains are likely. The ActivTrader market sentiment tool shows that 59 percent of traders are still bearish towards gold.
A drop in bearish sentiment has taken place over the last few days, and I think traders are becoming too bearish towards the price of gold, as the up move above the $1,800 level starts to stall prematurely.
Gold short-term Technical Analysis
The short-term technicals for the yellow metal shows that a bullish inverted head and shoulders pattern will be activated if the price moves above the $1,830. The mentioned bullish pattern has yet to be totally confirmed as price has fall just short of $1,830.
The $1,950 level is the target of the bullish price pattern, making it something to watch very closely if the price starts to hold above the $1,830 level. Key support is found at the $1,780, $1,750, and $1,730 level.
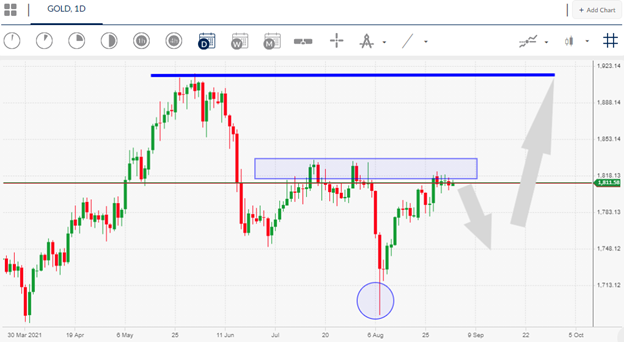
According to the daily time frame, gold is struggling to overcome and stage a daily price close above its 200-day moving average, around the $1,820 resistance level. This is the key bullish/bearish marker to watch this month.
On a long-term basis, the weekly chart shows that gold is clearly starting to form a cup and handle pattern, which looks to be near completion.
An explosive breakout above the $1,900 level could prompt a test of the $2,080 and $2,200 level. So keep an eye on the 200-day moving average this week and month.


