The US dollar has been correcting lower against the South African rand currency, due to Federal Open Market Committee Chair Powell failing to announce tapering at Jackson Hole and commodity prices rising once again.
Due to a substantial increase in COVID-19 cases in South Africa, plus country wide riots and looting, the South African rand has been under pressure against most major currencies on the foreign exchange market.
Slowing growth in China has also been weighing on the rand. China, a major buyer of commodity buyer in South Africa, has recently seen manufacturing data turning negative, further hinting that the world’s second-largest economy is slowing
Contained inflation in South Africa, coupled with rising jobless data and weak domestic economic data could also be pointing to further instability for the South African economy. This could spell further USDZAR strength.
Fundamentals are clearly a big part of the USDZAR pair. Especially South African fundamentals, which appear to be worsening, meaning that keeping a close eye on the South African economy is very important for USDZAR traders this month.
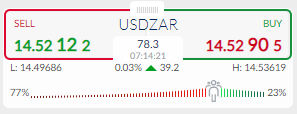
Sentiment towards the USDZAR pair is providing a minor yellow flag. According to the ActivTrader Market Sentiment tool some 77 percent of traders are bearish towards the pair, amidst the latest correction.
The growing bearish bias is probably a plus for the USDZAR pair, meaning that the correction may be nearing an end. The current sentiment dynamics certainly hint that the USDZAR pair is in the sweet spot for a reversal.
USDZAR Short-Term Technical Analysis
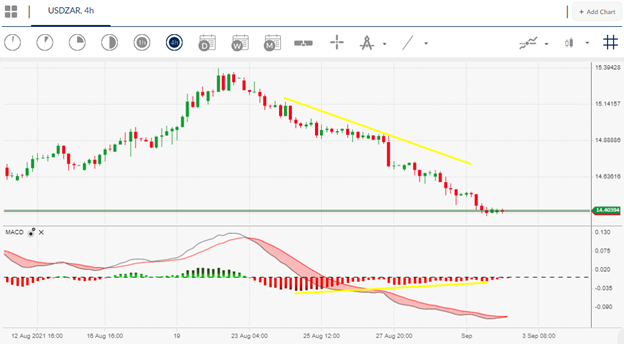
The four-hour time frame shows that the USDZAR pair has formed significant amounts of negative MACD price divergence during its recent price pullback from the $15.40 price pullback.
Looking more closely at exactly where the divergence started it appears that the $15.00 area is the main area, so over the short-term we could see a rise back towards this key area.
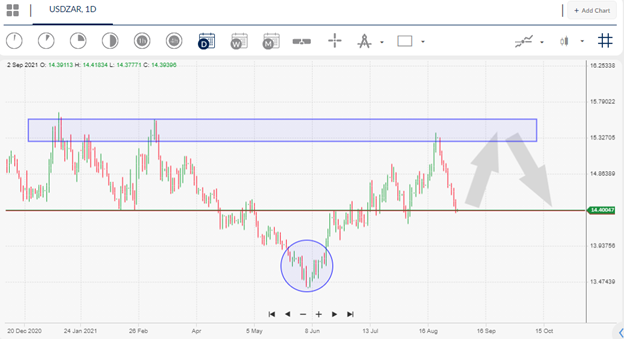
Looking at the daily time frame, a large complex head and shoulders pattern appears to be forming, with the pattern taking some time to unfold as the $13.00 to $16.00 price range remains prevalent.
Due to the existence of this large bearish pattern the medium-term picture is negative, so it is probably best looking to fade rallies towards the top of the mentioned price range.


