Gold has started to trade back above the $1,800 resistance level as the yellow metal enjoys strong buying demand over the news that the FED is not likely going to be announcing tapering this week at Jackson Hole.
The market reaction was very clear after the FED announced that Jackson Hole was going to be held virtually. The classic QE for longer trader took place, meaning that the US dollar sold-off, stocks rose, and the value of gold also increased.
Looking ahead this week the technical are pointing higher, and more so after the psychologically important $1,800 technical barrier has been surpassed, which was a particularly difficult sticking point for bulls last week.
Goldman Sachs has also been on the wires noting that they are expecting more strength in the yellow-metal due to broad based weakness in the US dollar currency and an emerging market demand recovery for gold demand.
The investment bank added “For gold to move materially higher though, there has to be a general risk-off event which will trigger demand for defensive inflation hedges such as the return of inflation worries”
Sentiment towards gold is looking at bit overextended. Last week bullish sentiment declined, however, on the Jackson Hole news that the event will be held virtually, bullish sentiment has increased significantly.
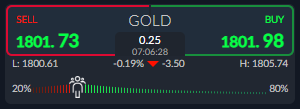
The ActivTrader market sentiment tool shows that 80 percent of traders are still bullish towards gold right now. This is typically a bad sign as too many traders are bullish, meaning that the early-week gains in gold could reverse in the short-term.
Gold short-term Technical Analysis
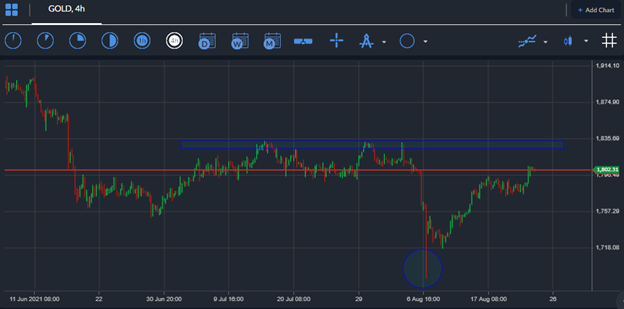
The short-term technicals for the yellow metal continue to show that a massive, inverted head and shoulders pattern appears to be taking shape. The bullish pattern will be officially confirmed if the price can recover towards the $1,830 price zone.
It should be noted that the size of the bullish pattern is around $150.00. Looking at the weekly resistance zones, I think $1,810 and $1,835 levels offer the strongest form of resistance prior to the $1,890 level.
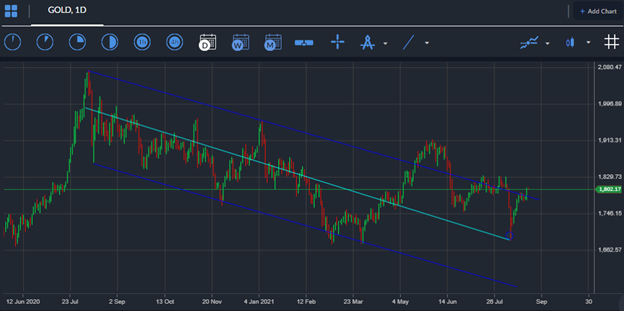
According to the daily time frame gold has broken above a falling price channel, which usually suggests solid buying interest and further price appreciation as these patterns are typically characterized as being reversal pattern..
According to the overall size of the falling wedge pattern it is possible that the price of gold is heading towards the $2,000 level. The $1,900 level offers the strongest resistance prior to the $3,000 level.


