The US dollar index has been struggling to find direction this week as traders and investors remained side-lined ahead of the outcome of the FOMC interest rate decision and policy statement.
Downside pressure is actually starting to build on the US dollar index on the technical front as a bearish head and shoulders pattern starts to weigh on the buck across both the lower- and upper-time frames.
The COVID-19 Delta variant is going to be something to watch out for during the FOMC policy statement this week. The FOMC may start to talk up downside risks and the need for QE to remain in place as long as the DELTA variant rages.
Cracks are already starting to show as COVID-19 lockdowns worsen. The IMF has just downgraded economic growth from emerging markets, while the CBA has issued a dismal Q3 growth forecast for Australia.
I would expect the US dollar index to tumble today after the FOMC policy meeting if the FED sounds dovish. Equally, the same is probably true for neutral tone, as the market was already becoming overly bullish after the June FOMC meeting.
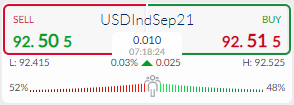
The ActivTrader market sentiment tool is showing that sentiment has neutralized, which indicates a level of uncertainty, following weeks of range bounds trading activity in the US dollar index.
It should be noted that bearish sentiment has dropped over recent weeks as traders have turned more bullish. If we see bullish sentiment increasing, I would take this as a counter signal.
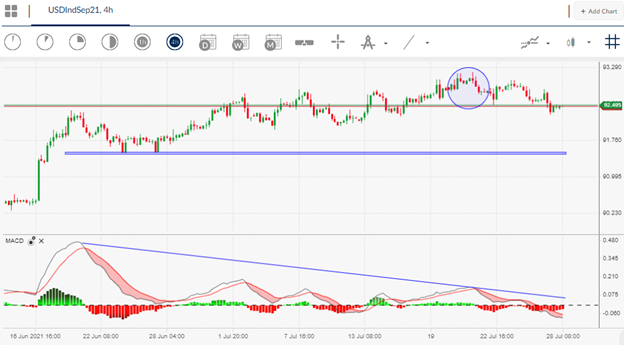
US Dollar Index short-term Technical Analysis
Looking at the four-hour time frame a head and shoulders pattern with downside potential greater than 100 points remains the big focus for traders right now.
Whether the pattern survives or is invalidated this week is likely to determine the next 100 points move in the US dollar index.
If bears can break the 91.55 support level then the US dollar index could tumble towards the 90.00 area, however, if the pattern is invalidated then we could see a surge towards the 94.00 area, at a minimum.
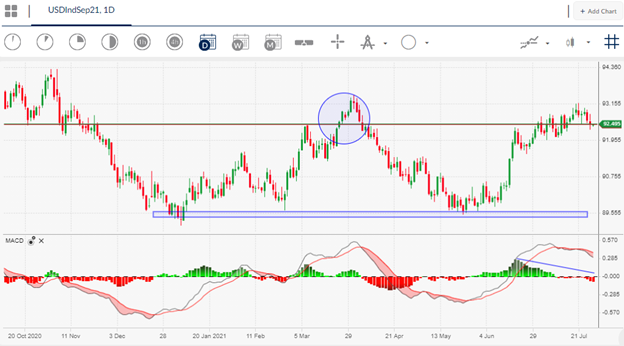
According to the daily time frame, a massive head and shoulders pattern with downside potential greater than 400 point is the most important technical consideration for traders. The pattern has not been invalided, despite weeks of bulls best attempts.
Bearish price divergence has also formed during on the Relative Strength Index and is warning that the July gains could quickly unravel at any moment unless the 93.00 level is breached.


