fbpx
High Leverage FX
  • Home
  • Market News
    • All
    • Economy
    • Forex
    • Markets
    • Opinion
    • Politics
    • Tech
    • World
    Asian equities could take a boost after strong gains seen on US equities

    Asian equities may trade on the back foot as traders took profits during Wall Street session

    USDMYR Technical Analysis

    USDMYR Technical Analysis

    Asian equities observe positive start as optimism on Wall Street echoes

    Asian equities could trade with negative bias reflecting caution awaiting Nvidia’s earnings report

    Asian equities could take a boost after strong gains seen on US equities

    Asian equities likely to trade within narrow range following volatile session on Wall Street

    Asian markets may experience volatility as global participants eagerly await significant upcoming events

    Asian markets may experience volatility as global participants eagerly await significant upcoming events

  • Economic Calendar
  • About Us
  • Trading Signals
  • Free Demo Account
High Leverage FX
No Result
View All Result
Home Market News World

Crude Oil Technical Analysis – $68.00 is the buy zone

Nathan Batchelor by Nathan Batchelor
June 10, 2021
in Markets, World
Reading Time: 3 mins read
0
Brent Crude Technical Analysis – $70.00 Next Target
332
SHARES
8.5k
VIEWS
Share on FacebookShare on Twitter

The price of West Texas Intermediate oil hit a new yearly high above the $70.00 resistance level after the United States Energy Information Administration June Short-term Energy Outlook reinforced market expectations of a demand-led recovery in oil markets.

Crude oil is approaching levels not seen since October 2018, and is quickly making gains above the $69.00 level. The EIA’s STEO report also suggested a drawdown of global oil inventories could be on the cards during the summer.

Furthermore, the latest upside move in crude oil was supported by signs from US and Iranian oil talks are stalling, which means that a delay in bringing back sanctioned Iranian barrels back to the market is more likely than not.

It is also noteworthy that the American Petroleum Institute released a report that estimated a 2.1 million barrel draw in United States crude oil inventories earlier this week, which further underpinned the bullish sentiment towards oil.

Given the strong forecast by the EIA in June, and declining global oil inventories, a clear picture is being built of a recovering global economy. The bullish economic backdrop hints that during the upcoming July OPEC meeting we could see an easing of production cuts.

On the technical front, the Relative Strength Indictor is approaching overbought conditions on multiple time frames, which is providing a warning sign that a pullback could be forthcoming in the near-term. The RSI indicator is testing towards above 70 on the weekly time frame, which is means crude oil is now overbought.

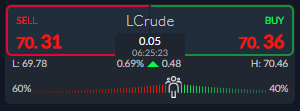
Market sentiment towards WTI oil remains bullish, with some 60 percent of traders holding a positive outlook. This one-way sentiment skew is mildly bearish, and it could suggest that crude oil could correct at any time.

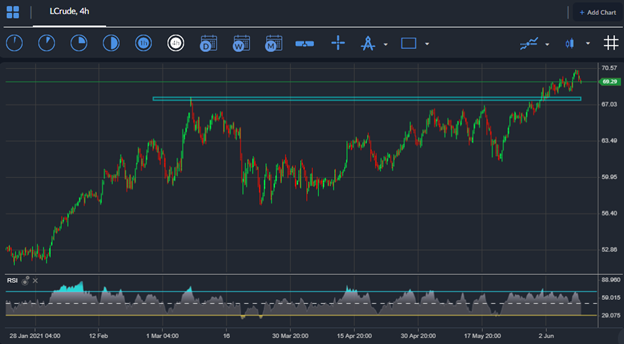
WTI Oil Short-Term Technical Analysis-

The four-hour time frame shows that WTI oil has broken above the neckline of a huge, inverted head and shoulders pattern, that is pointing to a coming rally towards $80.00.

As long as the price of WTI oil holds above the $68.00 level then the bullish pattern remains activated. Any pullback towards the neckline of the pattern will likely be seen as a buying opportunity.

See real-time quotes provided by our partner.

WTI Oil Medium-Term Technical Analysis

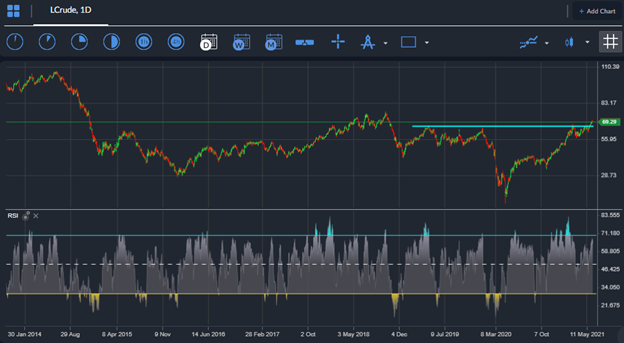
Looking at the daily time frame WTI oil is testing towards a twenty-month trading high, with the $76.60 level the next major upside resistance level to watch now that the $70.00 level has been broken.

Traders should be aware that WTI oil has relatively limited technical resistance until the $90.00 level if bulls can overcome the $76.60 level over the coming days and weeks. The only warning sign is the RSI indicator, which is overbought on the daily and weekly time frames.

See real-time quotes provided by our partner.

Tags: crude oilOPECUS and IranWTI
Previous Post

Asia stocks trading flat following handover from Wall Street

Next Post

EURGBP Technical Analysis - Head and shoulders watch

Nathan Batchelor

Nathan Batchelor

Related Posts

Asian equities could take a boost after strong gains seen on US equities
Markets

Asian equities may trade on the back foot as traders took profits during Wall Street session

May 23, 2024
Asian equities observe positive start as optimism on Wall Street echoes
Markets

Asian equities could trade with negative bias reflecting caution awaiting Nvidia’s earnings report

May 23, 2024
Asian equities could take a boost after strong gains seen on US equities
Markets

Asian equities likely to trade within narrow range following volatile session on Wall Street

May 22, 2024
Asian markets may experience volatility as global participants eagerly await significant upcoming events
Markets

Asian markets may experience volatility as global participants eagerly await significant upcoming events

May 21, 2024
Asian equities might experience mixed trading due to profit-taking and anticipation of options expiry trades
Markets

Asian equities might experience mixed trading due to profit-taking and anticipation of options expiry trades

May 17, 2024
Asian equities may experience significant sell-off following the lead of the US
Markets

Asian equities likely to trade positively following significant rally in US stocks and bonds

May 16, 2024
Next Post
EURGBP Technical Analysis – Head and shoulders watch

EURGBP Technical Analysis - Head and shoulders watch

Leave a Reply Cancel reply

Your email address will not be published. Required fields are marked *


Market Overview

Categories

  • Economy
  • Forex
  • Gadget
  • Markets
  • Opinion
  • Politics
  • RSS Feed
  • Startup
  • Tech
  • Trading Signals
  • Uncategorized
  • World

Site Navigation

  • Home
  • Market News
  • Economic Calendar
  • About Us
  • Trading Signals
  • Free Demo Account
  • Home
  • Market News
  • Economic Calendar
  • About Us
  • Trading Signals
  • Free Demo Account

© 2019 High Leverage FX - All Rights Reserved.

No Result
View All Result
  • Home
  • Market News
    • Forex
    • Economy
    • Opinion
    • World
    • Markets
    • Politics
  • Economic Calendar
  • Trading Signals
  • About Us
  • Free Demo Account
[gtranslate]

© 2019 High Leverage FX - All Rights Reserved.