The price of gold is trading at a fourteen-week high as the yellow-metal comes back into favour with investors and gold bugs, following a strong technical rebound from the $1,808 support region last week.
One of the dynamics that is prompting gold to rise right now is a loss in confidence that the price of Bitcoin will continue to rise. It appears that traders and investors are flocking back into gold and silver over environmental concerns surrounding Bitcoin.
Last week Tesla announced that they will not allow clients to buy Tesla’s in Bitcoin anymore over concerns about it electricity usage and carbon footprint. Rumours abound that Tesla is about to dump its Bitcoin holdings.
As inflationary pressures ramp up in the United States, gold is on the rise as it often seen as an inflationary hedge and a store of value. Gold looks set for more gains ahead as Bitcoin’s pain is currently the yellow-metals gain.
After last week’s soft US Retail Sales print, and recent weakening of the US employment situation gold looks to be in the sweet spot for investors, meaning that more QE and a low interest rate environment should support more gold gains.
Additionally safe-haven demand has driven the metal higher at the start of this trading week, and even more as the conflict in the Gaza strip looks to be worsening. This could drive up commodity prices.
This week gold should continue its recent recovery if bulls can get comfy above the $1,865 level. Last week traders used to buy into the dip, I suspect they may use the same tactic if gold revisits the $1,840 to $1,830 price area.
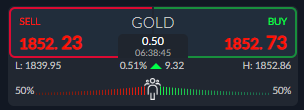
Current sentiment towards gold on the ActivTrader Market Sentiment tool shows that market is 50/50 split about the direction of gold. If we see traders turning negative towards the yellow-metal and the price of gold heads high I would expect an attack towards the $1,900 area.
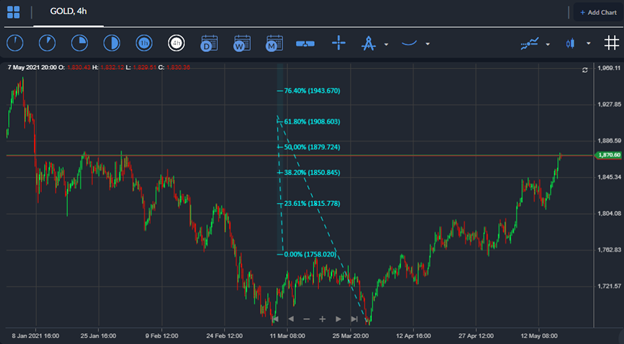
Gold short-term Technical Analysis
The short-term technicals for gold show that a small, inverted head and shoulders pattern has formed, following the pullback towards the $1,808 level last week, and subsequent push back through the $1,845 resistance level.
According to the overall size of the bullish pattern the price of gold could be preparing to target the $1,879 level in the short-term horizon.
Fibonacci extension analysis is showing that the 161.80 percent Fib extension target of the yearly low to the $1,759 level is found at the $1,891 level. This is my favoured upside target. $1,908 and $1,943 are all solid upside targets to watch past $1,900.
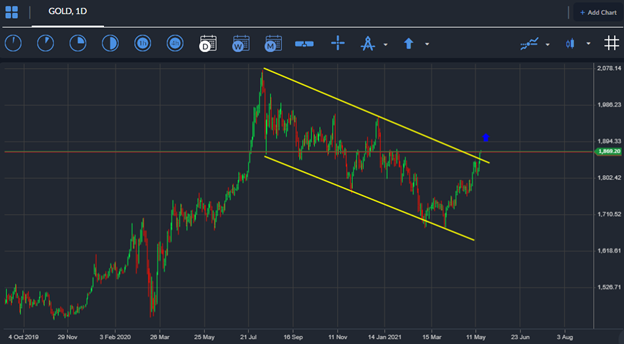
According to the daily time frame, gold will be turning technically bullish if buyers can take out the metals key 200-day moving average, around the $1,860 level..
A key falling trendline resistance is also located above the 200-day MA, around the $1,865 level. The key trendline is the top of a falling price channel, which is implying a potential $200.00 advance.
If bulls can break past key trendline resistance, I think that the price of gold could surge towards the $2,000 and finally the $2,065 price level.


