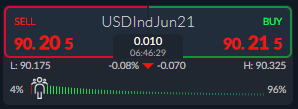
The US Dollar Index is treading water above the 90.00 level as the ramifications of last Friday’s weaker than expected monthly jobs report from the United States economy continues to be felt across the foreign exchange market.
Weakness in the US dollar has been broad based, with the euro, pound, and most major commodity-related currencies gaining strength against the buck. The euro currency in particular is worth watching over the coming days as it makes up a considerable amount of the US dollar index basket.
Most major economists are pricing in more gradual US dollar weakness as the United States current account deficit and national debt continues to grow while the Federal Reserve prints huge amount of US dollar.
Additionally, the Biden administration is expected to spend huge amounts of government money in further stimulus packages and infrastructure bills. Officially, the administration has at least another 30 months left in power, so markets may be pricing in more US dollar weakness under the Biden administration.
If we factor in higher inflation, and traders moving into Bitcoin and gold as stores of value in the face of US dollar weakness, then it makes sense that further US dollar depreciation is coming down the road.
The technicals clearly show that a major technical meltdown could place if the 89.20 level is broken, meaning that the US dollar index is extremely close to breaking under the yearly low, and then falling towards its lowest level since 2014.
Some 96 percent of traders are bullish towards the US dollar index right now, meaning that retail traders are feeling maximum pain right now. The one-way sentiment skew means that more losses in US dollar index are extremely likely while retails traders remain this wrong sided.
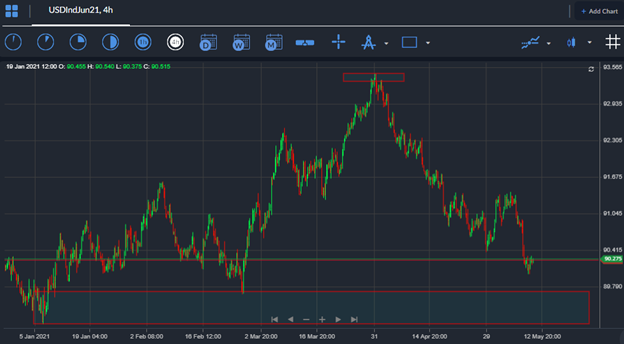
US Dollar Index short-term Technical Analysis
Looking at the four-hour time frame a large head and shoulders pattern has formed, following the recent sell-off in the US dollar last Friday.
The bearish price pattern will be activated if the US dollar index falls below the 90.20. According to the overall size of the pattern the US dollar index could fall towards the 87.00 level.
It is particularly noteworthy that the current yearly low for the US dollar index is located at the 88.30 level.
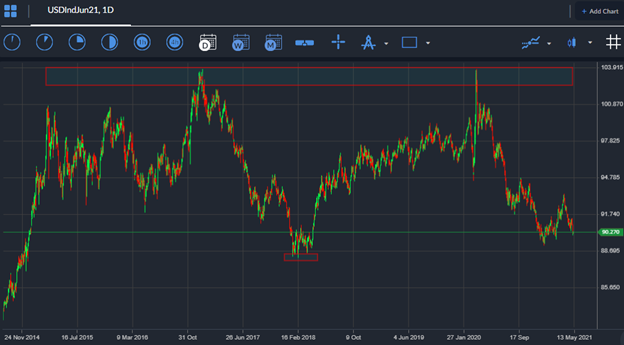
According to the daily time frame, the US dollar index will be in massive trouble if a large, inverted head and shoulders pattern is invalidated once the price crosses the 88.30 level.
The invalidation of the bullish price pattern could cause a decline towards the 75.00 support area. This is an extreme scenario; however, it is noteworthy that a technical meltdown will take place if the pattern is invalidated.


